In this blog post, we will briefly discuss on the differences and similarities between two market leaders in the data analytics and business application tools, namely, Power BI (Power Business Intelligence Tool) and Microsoft Excel. The top differences one should know while working with or in these tools.
What is Power BI?
The “BI” in Power BI stands for Business Intelligence; it’s software that makes reporting easier and more visually appealing. This platform is awesome for creating interactive dashboards that users can easily share.
As you know, Excel is a spreadsheet application that can do just about ANYTHING (including interactive dashboards). But that doesn’t mean there aren’t advantages to using Power BI, especially in conjunction with Excel. Let’s take a look at some of the advantages and disadvantages of each application.
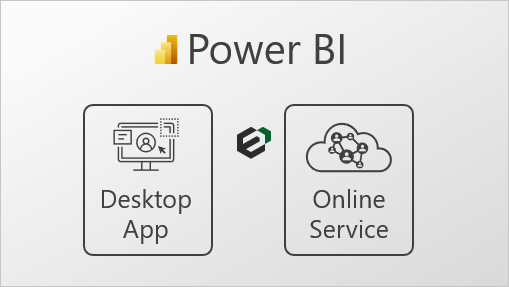
Power BI Desktop App
Power BI has two major components, the Desktop App and Online Service.
Benefits of Power BI
Here are a few key benefits of Power BI that make it an indispensable tool in the workplace:
- Great Accessibility: Power BI provides you with advanced accessibility through its ability to run remote apps on a number of Internet platforms and devices like iOS, Android, and Windows to name a few.
- Key Functionalities: Power BI provides drag-and-drop functionality that lets you generate customized reports swiftly. It also provides the option of digging further into the data visualizations to help understand the data better. The usage of natural language queries means that the users don’t have to spend time trying to learn a complex query language.
- Embeddable Attributes: It provides users the ability to embed Business Intelligence and Analytics seamlessly. You can build fully customized reports and dashboards to better suit your business use cases and data requirements.
- Connectivity: Power BI supports several data sources, for instance, the financial data collected from your company’s ERP or the sales data from the CRM. By providing access to Azure Cloud, On-Premise, and third-party data sources, you can create new datasets from a wider range of disparate sources.
Features of Power BI
Some of the main features of Power BI are listed below.
- Hybrid Development: Power BI offers integrations with many connectors that allow users to connect to various data sources.
- Modeling View: Power BI allows users to divide and slice complex data models into a simpler form, separate diagrams, multi-select objects.
- AI Support: Power BI supports Artificial Intelligence in Data Analytics that users can leverage to prepare data, build Machine Learning models and quickly identify insights from structures as was unstructured data.
- Responsiveness: Accessing presentations and reports on mobile phones can sometimes hinder responsiveness. However, Power BI allows you to view enlarged Navigation Trees on both iOS and Android platforms. You can zoom in or out of the Reports or Graphs to make sure that all of the information is visible.
- Data Connectivity: Power BI houses support for various connectors that integrate with the Cloud data. This allows businesses to easily view metrics or visuals. The data source is directly integrated via the connector and once the connector successfully retrieves the data, you can create interactive visuals to identify trends and patterns.
What About Microsoft Excel ?
Excel also gives you the ability to create dashboards that are interactive, using slicers and tables. Admittedly, it might not look as sleek as Power BI and it does lack some of the cross-filter capabilities. But the major advantage of Excel is that it can do so much more than create reports.
As just one example, you can create a loan schedule with a flexible grid that allows you to insert inputs and have complicated calculations as outputs. That means Excel is much more useful for financial modeling and forecasting.

Benefits of Microsoft Excel
As the most widely known Spreadsheet application across the globe here are a few benefits of Microsoft Excel:
- Ad-Hoc Computations: Microsoft Excel is a really good tool for quick analyses and computations. Microsoft Excel provides over 400 available functions distributed across 11 themes to make your computations easy like never before.
- Code to Automate: You can use the coding language VBA (Visual Basic for Applications) which gives you the ability to code everything that can be carried out manually in Microsoft Excel thus increasing your efficiency.
- Free Templates: Microsoft Excel gives you the freedom to create dashboards and provides several free templates that you can try out for your business operations.
- General Purpose Tool: Microsoft Excel stands out as a tool that is not only a valuable Spreadsheet tool, but can also be used for Data Visualization, Data Entry, or Web Scraping.
Features of Microsoft Excel
Some of the salient features of Microsoft Excel are as follows:
- Easy Arithmetic Solutions: Excel, with its extensive library of formulae, can perform arithmetic operations on a massive scale. Furthermore, if a value is changed, you can easily redo a complex calculation. This feature is useful for businesses that need to manage yearly sales and other long-term data
- Formatting Options: Excel provides a variety of formatting options such as italics, highlights, custom coloring, and so on. Businesses can distinguish their valuable data from the rest of the information in this manner. You can, for example, use row highlighting to highlight specific data in the Accounting Sheets.
- Availability of Online Access: Excel, as part of the Office 365 Productivity Suite, enables business teams to seamlessly access their files over the cloud network. Moreover, if you have a working internet connection, you can access and modify your Excel sheets remotely using your PC, mobile device, tablet, or other devices.
- Charts for Analysis: Excel allows you to create comprehensive data charts quickly and easily. After your data has been filtered, you can easily create a Pie Chart or Clustered Columns with a few clicks. You can also change the colors and borders of your charts to make them more appealing and elegant.
Similarities Between Power BI and Excel
Both Excel and Power BI use Power Query and Power Pivot. So if you’ve learned either of those skills in Excel, they will help you understand and use Power BI better.
These two systems both integrate really well because they are both created by Microsoft. So if you’ve created a data model in Excel, and want to publish it in Power BI, the transition will be seamless.
In addition, both Excel and Power BI integrate really well with other Office applications, such as Teams and Power apps, which will help you to save time and automate processes.
Because of these integrations and the fact that you probably already have some experience with Microsoft Office tools, I think Power BI is superior to other Business Intelligence options out there.
So, Which Is Better?
The great thing about this comparison is that you really don’t have to choose one over the other. Excel and Power BI work really well in tandem, especially if you are using Excel for the data crunching and Power BI for the presentation and sharing.
As an Excel Promoter, of course, we are a big advocate for all that Excel can do, but we wouldn’t hesitate to use Power BI to soup up some of my reports and dashboards as needed.
Microsoft Excel was the go-to Business Intelligence and Data Visualization solution for organizations before Self-Service BI tools such as Power BI came into the picture. Microsoft Excel is one of the most popular Spreadsheet applications, while Power BI has made its mark with modern data intelligence features while delivering better insights than Microsoft Excel. You can also read out an article about Power View Excel. The differences between the two can be summarized in the following manner –
- Excel is used to organize data, transform it and perform mathematical operations and calculations. On the other hand, Power BI was conceived as a business intelligence and data visualization tool for businesses.
- Excel has limitations in the amount of data it can work with. In contrast, Power BI can handle much larger amounts of data.
- Power BI can connect to a large number of data sources, while Excel’s connectivity capacity is limited. Also, unlike Excel, Power BI can be easily used from mobile devices.
- Power BI has comparatively faster processing capability than Microsoft Excel.
- Power BI dashboards are usually more appealing, interactive and customizable than those in Microsoft Excel.
- Power BI is a more powerful tool than Excel in terms of comparison between tables, reports or data files.
- Power BI is more user friendly and easy to use than Excel.
Final Conclusion
Microsoft Excel is an office 365 product from Microsoft. It was initially released in the year 1985 under Microsoft Corporation and a current version is Excel 2018. Excel is a type of spreadsheet application that captures data in the form of rows and columns. A recent version of Excel is enriched with a wide variety of features and applications. You can turn data into insights.
Power BI is a business analytics tool from Microsoft. Power BI is a collection of software services, apps, and connectors that work together to turn your unrelated sources of data into interactive insights, coherent and visually immersive. Power BI easily connects to different data sources of any size.