
Creating WAFFLE Chart in Excel
In this blogpost, we will understand about WAFFLE Chart, their use and how to create
In this blogpost, we will understand about WAFFLE Chart, their use and how to create
Introduction to Funnel Charts in MS Excel The best way for you to track your
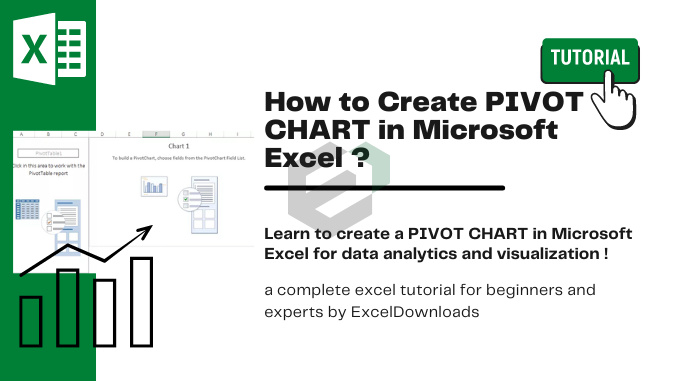
Introduction to PIVOT Charts Data in a visual way not only helps the user to

In this blog post, we will discuss about inserting people graph in our excel data
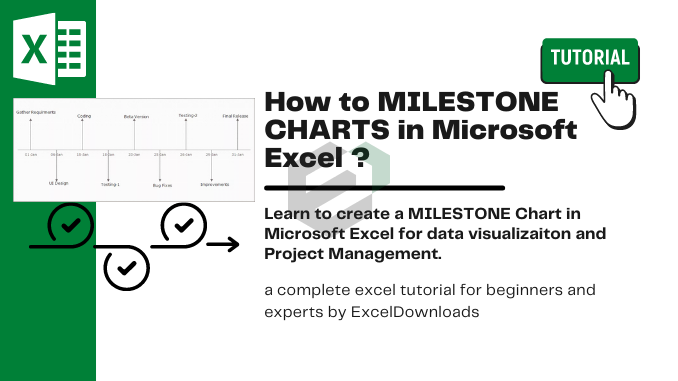
In this blog post, you will learn how to create and customize milestone charts in

In this tutorial blog, you will learn about speedometer and how to create one for
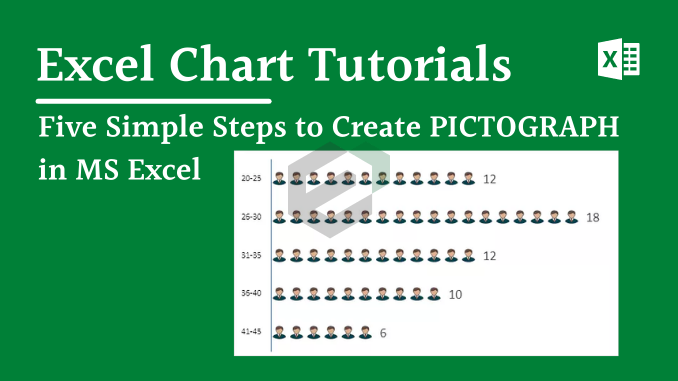
In this tutorial blog by ExcelDownloads, we will discuss about Pictograph, how we can create
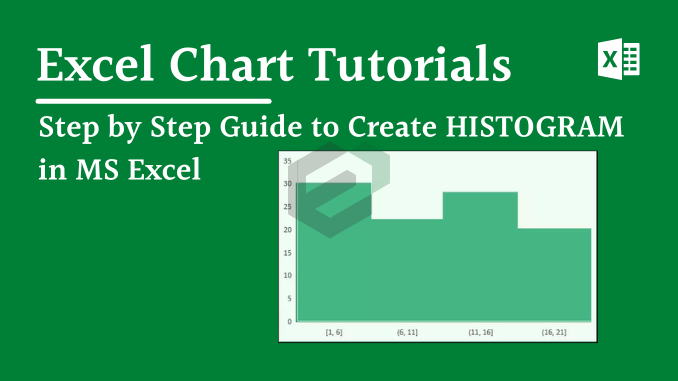
In this tutorial blog, we will learn about the basic steps to create Histogram in
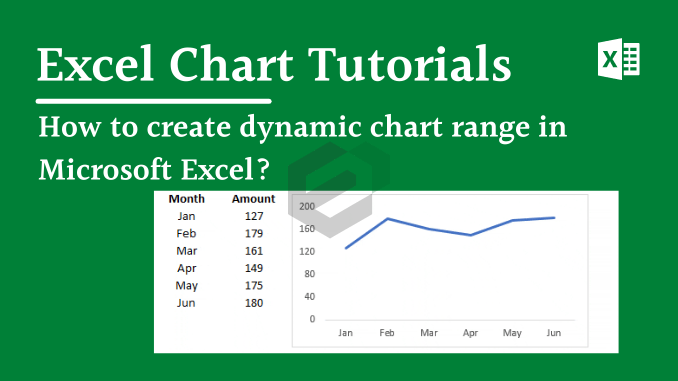
Whenever you create a chart and when you make some changes around the source data,

What is a HEAT MAP in Excel? In Excel, a Heat Map is a presentation

What is a Step Chart ? A step chart is a perfect chart if you
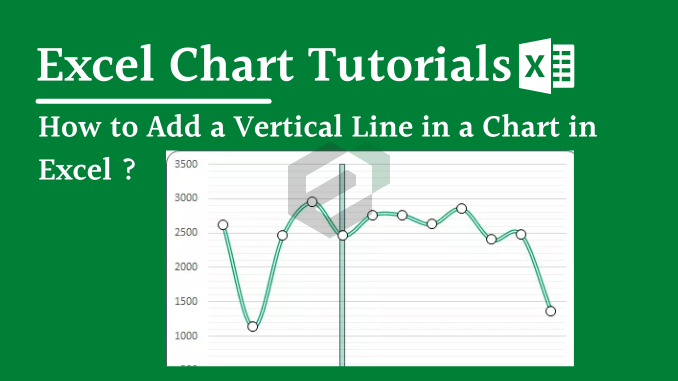
Background Sometimes while presenting data with an Excel chart we need to highlight a specific
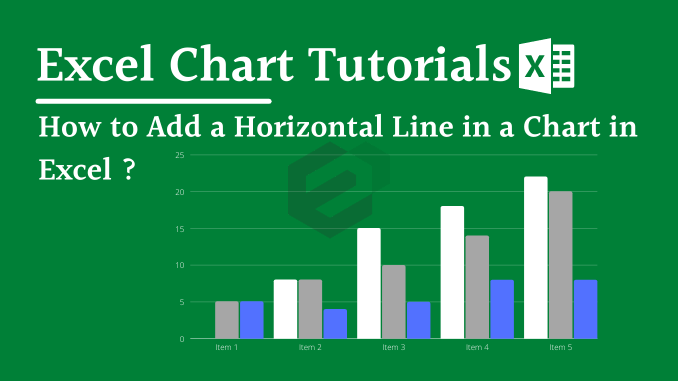
Introduction While creating a chart in Excel, you can use a horizontal line as a