Create a social media performance and engagement dashboard in Excel and spreadsheet using ready-to-use framework and stunning data visualization. This tool enables you to create various free templates in a short time for your social media profiles in websites like YouTube, Instagram, Mix, LinkedIn etc. Download this social media analytics excel template to analyze and boost your SEO, Social Media engagement and more.
If you or your client have a YouTube channel, this article and excel dashboard template is for you! Everyone is interested in what kinds of social channel activity can one’s metrics can generate.
If there are lots of visitors from social media on your website or social media channel, then your channel can be popular in a short time. We cannot overlook that this can also have a positive financial impact.
Just a few words about the social media dashboard. This social media dashboard template comes with a classic grid layout to display 12 key YouTube metrics that belong to each major social media. The framework enables you to stay on top of social media analytics from all of your favorite channels.
Just replace the key metrics and you’ll able to create various reports for Twitter, Pinterest or Facebook analytics. The customization as per your requirement can be done easily.
Metrics relevant in this Social Media Performance Excel Dashboard
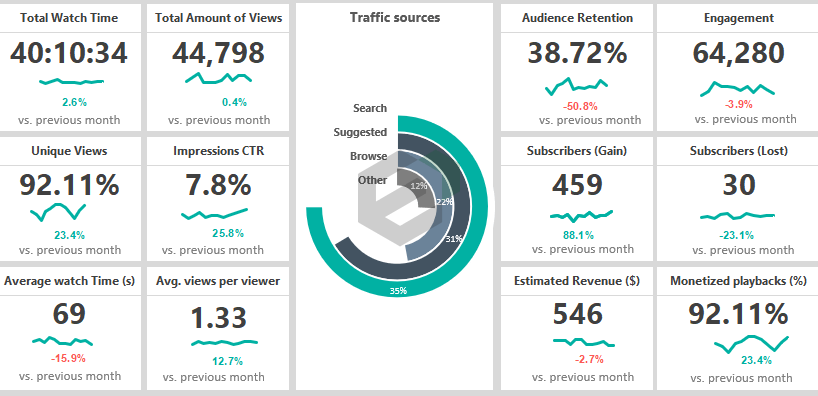
Remember, this template focuses in the YouTube Channel performance, which you need to alter as per your requirement. Using this free excel dashboard for Social Media Performance, we’ll track the following indicators or parameters :
- Total Watch Time
- Total Amount of Views
- Unique Views
- Impressions CTR
- Average watch Time (s)
- Average views per viewer
- Audience Retention
- Engagement
- Subscribers (Gain)
- Subscribers (Lost)
- Estimated Revenue ($)
- Monetized playbacks (%)
Discover and Customize the layout of Social Media Dashboard in Excel and Spreadsheet
To discover and customize, you can use historical approach i.e. using old-school solutions in Excel and Spreadsheet, but we can come up with something completely new that you have never seen before. We have chosen the latter one; it is worthwhile for you to do the same if you want to dazzle the audience or the bosses or the user of the information.
Let’s examine and observe the Workbook structure! It’s clean and simple.

The Data Sheet and Data Model : Calculate the variance
Firstly, you can add your data to the Data Worksheet and perform data modeling. Now we’ll apply a nested IF formula available in EXCEL. Using this formula, we can identify and display the variance between the selected month and the previous month. See the demonstration below for clarity :

Build a Visualized Drop-down list
Let us see the dashboard sheet ! If you need a monthly breakdown for your dashboard, the best choice to create a drop-down list, nothing special, we have used it many times before. We have chosen 12 social media metrics.

Let’s examine these in the given period. We have already talked about the menu that is in the upper right-hand corner of the template.
Create a Scorecard for Social Media Performance Dashboard
Now we have to talk about the core component of our dashboard. Let us see the data set behind the widget.
- As first, add a data label for the widget.
- After that, link the data from the Data Worksheet to the main Dashboard sheet.
- Create a simple line chart.
- Select the source range. Browse the cell which contains actual value. So we’ll get and display an annual trendline.
- Finally, link the variance from the calculation sheet.

Repeat these steps for every widget.
We have linked the scorecards to the calculated values on the data worksheet. All cards will be updated when you change the months in the drop-down list.
That’s all!
Apply Conditional Formatting
Jump to the calculation sheet ! Now we’ll apply conditional formatting. Select the cell, then click to the Home tab and select conditional formatting.

Create new rules for the current selection. We can display the positive values green and the negative values red.
Tip: Don’t forget: Some metrics have inverse characteristics, for example, ‘Subscriber Lost.’
Okay, back to the Dashboard sheet. For the main metrics, create a custom radial bar chart manually or use a chart add-in for data visualization purposes.
Choose an impressive chart type to display your most important YouTube metrics.
Social Media Dashboard – Conclusion and Final Words
Allow us a little Excel-related detour, so please don’t skip over it. One of the news media blogs has asked the currently best Excel professionals what they think about the relationship between BI and Excel.
That’s the fact that web-based solutions are on the rise, and the newest business intelligence tools of Microsoft Excel (Power BI, Power Query) get more and more emphasis.
Then again, all professionals harmoniously stated that Excel would be our colleague in everyday work. We recommend using free excel dashboards and templates. Furthermore, you can make wonderful business presentations using the data and analytics from this excel dashboard.