Product Metrics is a simple product management dashboard in Excel and Spreadsheet. This template comes with combination of bar graph, area chart, pie chart and line graph. You can map your product wise revenue using combined bar chart. The dashboard updates automatically once you capture the information in the table at DATA worksheet.
About product metrics and analytics excel dashboard
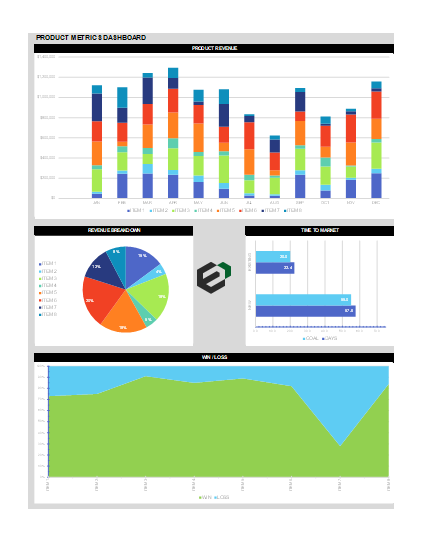
Download this product management dashboard for simple products, their revenue, win/loss graph, category wise revenue summary/ spread and more. This dashboard is helpful in creating visualization for the following metrics –
- Product Revenue – Update the item names and month wise revenue on each product. You will get the stacked bar chart once you are done with your data. Also, You can use this analytics for yearly and monthly product wise sales and revenue.
- Revenue Breakdown – This analytics helps you understand your hero products. [This template can also be useful for your services]. Thus, Once you update your product monthly revenue, this annual figures updates automatically. SUM() Feature helps to capture the annual sales figure. Percentage of sales in each product is computed automatically.
- Win and Loss Chart – Win and loss charts are useful in understanding the market penetration for each product. There can be replacements, sales returns and lost opportunities at each product level. Thus, this chart is useful for sales managers to get details on market acceptability for each product.
- Time to market analytics – This is unique way of comparing your goals and achievements. This analytics is useful to see if the applied efforts are successful in meeting the goals set.
Download and use Product analytics dashboard
Now, Let us discuss on the how to download and use the Product dashboard in Excel format. To download and use this free excel template, follow the steps below –
- Firstly, You should have Microsoft Office/ Microsoft Excel installed in your system.
- After installing Excel or Spreadsheet, download the zip file of this template, extract the template using WinRAR or 7Zip decompressing software.
- Once extracted, you can open the file using Excel and start entering data or customizing the template.
- Furthermore, To download fonts and typefaces compatible with Microsoft Excel > Calligraphic.net