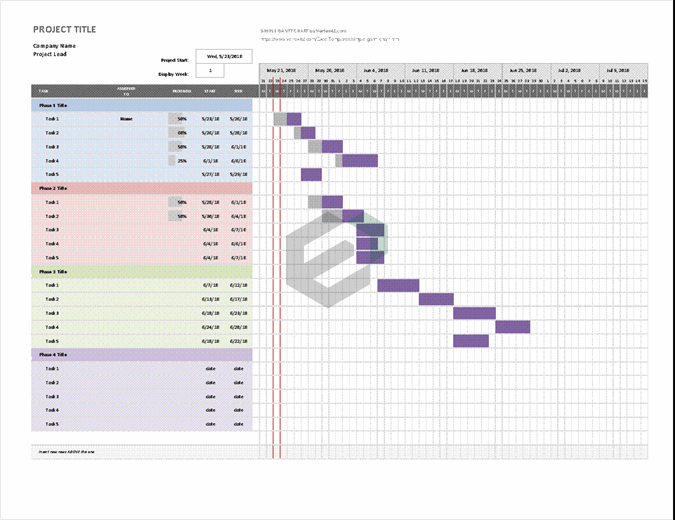
Create a project schedule and track your progress with this Gantt chart template. The professional-looking Gantt chart is provided by Excel Downloads (Originally published by Vertex42.com, a leading designer of Excel spreadsheets). The Excel Gantt chart template breaks down a project by phase and task, noting who’s responsible, task start and end date, and percent completed.
Share the Gantt chart in Excel with your project team to review and edit collaboratively. This Gantt chart template is ideal for business plans, project management, student assignments, or even home remodels.
Other Project Management Excel Templates
Gantt Charts and Project timeliness are very important aspect of project management. Any project manager should be competent to allocate resources and assign timelines for activities in a project so that the overall objective and timeline of the project is met.
You can try out the other project timelines and management related excel templates and dashboards highlighted below :
- Simple Gantt Chart excel template for medium and small projects
- Gantt Project Planner Excel Template for Project Managers
- Simple and Elegant Gantt Project Chart Excel and Spreadsheet Templates
- Date Tracking Gantt Chart Excel Template for Project Management
- Agile Project Management Chart Tool in Excel and Spreadsheet
- Project Timeline Tracking Excel Template for Project Management
About Gantt Charts
As discussed earlier, Gantt Charts are essential when it comes to project management. This is because the basic idea behind Gantt Charts is very simple; they simply tell you about the overlap of processes. It allows you to quickly see the status of any project and see how much additional effort is essential to get the work completed.
It also allows you to manage processes or activities that depend on the completion of other processes. These activities can be known as “Dependent activities”.
Mostly, Gantt Charts allow project managers to quickly give estimates about how long the project will take to complete. Such projections are very complex due to the multitude of processes involved in large projects; Gantt Charts simplify the projections by presenting a lot of information in one glance.

