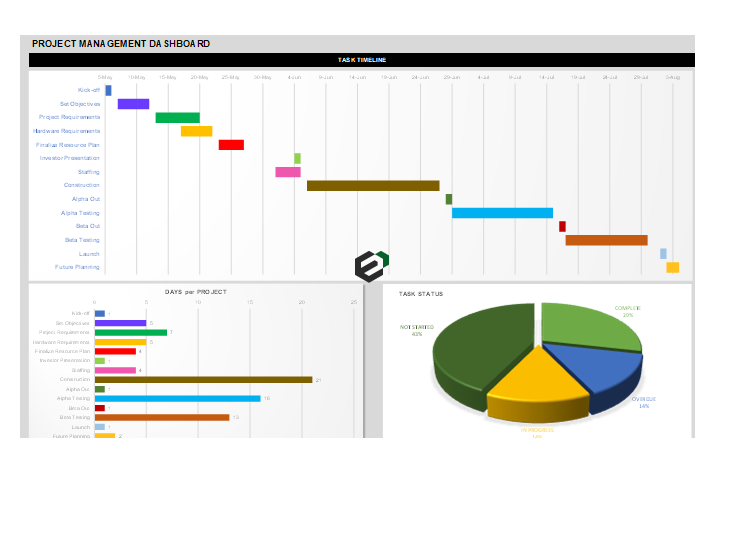
Project Management Dashboard is a simple and easy to use Gantt Chart, pie chart and project management template in Microsoft Excel. Use this template to organize your activities and tasks by tracking your daily project status. You can track the percentage of completion in this template for each activity. This is useful for construction projects, computer projects, software development projects and housing projects.
Also check: Project Highlights Dashboard in Excel
Gantt Chart is an important tool to make project management efficient. Download this free Gantt chart template to organize and monitor your project milestones and project timelines easily.
Introduction to Gantt Charts
As discussed earlier, Gantt Charts are essential when it comes to project management. This is because the basic idea behind Gantt Charts is very simple; they simply tell you about the overlap of processes. It allows you to quickly see the status of any project and see how much additional effort is essential to get the work completed.
It also allows you to manage processes or activities that depend on the completion of other processes. These activities can be known as “Dependent activities”.
Mostly, Gantt Charts allow project managers to quickly give estimates about how long the project will take to complete. Such projections are very complex due to the multitude of processes involved in large projects; Gantt Charts simplify the projections by presenting a lot of information in one glance.
Using Gantt charts for project management
Microsoft Office and Spreadsheet applications can be useful when it comes to project management and monitoring. Gantt Charts become much easier to understand with the help of an example.
Let’s say, you are trying to estimate how long it will take create a new product and send it to the market. The project will involve multiple people and multiple processes running at the same time. You will have to ensure that the product can be manufactured within your company’s factory and create a production schedule for it. Marketing will have to create an identity for the product and then create advertising campaigns for the product.
Thus, Gantt Charts help you in identifying the processes involved in the overall completion journey and map them to monitor your progress.
Similarly, in a construction project there is concept of Work Breakdown Structure. Each activity or milestone needs good monitoring control to complete the project. There will be involvement of multiple personnel and sub-activities. Thus, this template can come handy to make project status reports.
You can check our Work breakdown Structure excel template as well.
Download and use project management dashboards
To download and use this free project management dashboards template, follow the instructions below –
- Firstly, You should have Microsoft Office/ Microsoft Excel installed in your system.
- After installing Excel or Spreadsheet, download the zip file of this template, extract the template using WinRAR or 7Zip decompressing software.
- Once extracted, you can open the file using Excel and start entering data or customizing the template.
- If you want to download this template for Presentations, explore – Gantt Chart Presentation template.

