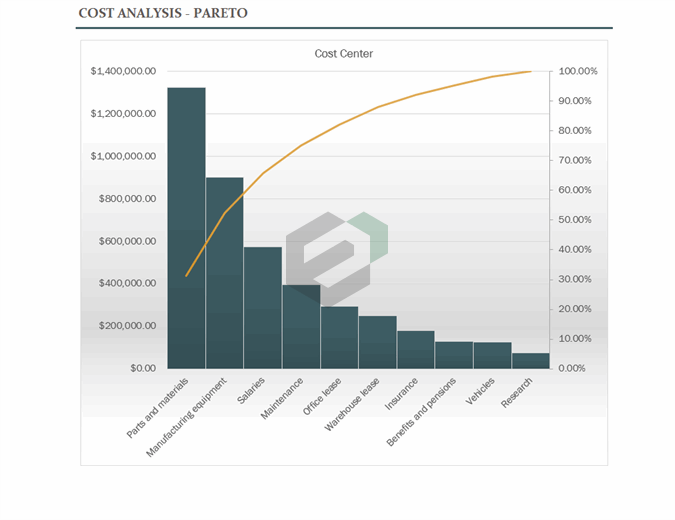
Analyze the costs of your business with this professional excel template, showing the data on a Pareto chart to give a quick assessment of where most of the money is going and where changes can have the greatest impact.
What is Pareto Analysis ?
Pareto Analysis is a concept that is used in business decision making based on the 80/20 rule. It is a decision-making technique that statistically separates a limited number of input factors as having the greatest impact on an outcome, either desirable or undesirable.
Steps of Performing Pareto Analysis
By applying the 80/20 rule, problems can be sorted based on whether they affect profits, customer complaints, technical issues, product defects, or delays and backlogs from missed deadlines. Each of these issues is given a rating based on the amount of revenue or sales, and time lost, or the number of complaints received. A basic breakdown of the steps could involve:
- Identify the problem or problems
- List or identify the cause of the issues or problems noting that there could be multiple causes
- Score the problems by assigning a number to each one that prioritizes the problem based on the level of negative impact on the company
- Organize the problems into groups such as customer service or system issues
- Develop and implement the action plan to solve the problems by focusing on the higher scored problems first
How to use Pareto Chart Analysis free excel template ?
The Pareto Principle, or 80-20 Rule, is a general rule-of-thumb or guideline that says that 80% of the effects stem from 20% of the causes. Vilfredo Pareto originally observed that in Italy, 80% of the land was owned by 20% of the people. Dr. Joseph M. Juran, a 20th century evangelist for quality management, applied this principal to quality control and preferred the use of the phrase “the vital few and the useful many” to describe the 80-20 rule. Today, Pareto Analysis is a guiding principle in business for –
- Customer Complaints (e.g. 80% of the complaints come from 20% of the customers)
- Management (e.g. 80% of the results come from 20% of the group)
- Sales (e.g. 80% of the profits come from 20% of the products)
- Quality Management for identifying the most important causes for defects (e.g. 80% of the problems come from 20% of the causes)
A pareto chart can help you quickly identify the most significant factors, but choosing which problems to fix may still require a cost-benefit analysis.
References : Vilfredo Pareto
You can also download other Pareto Chart Analysis Excel Templates from Excel Downloads.
Download and use Pareto Analysis Excel Template
To use this free PARETO ANALYSIS excel template, you should have Microsoft Office/ Microsoft Excel installed in your system.
After installing Excel or Spreadsheet, download the zip file of this template, extract the template using WinRAR or 7Zip decompressing software.
Once extracted, you can open the file using Excel and start entering data or customizing the template. You can customize this free excel template as per your requirement.