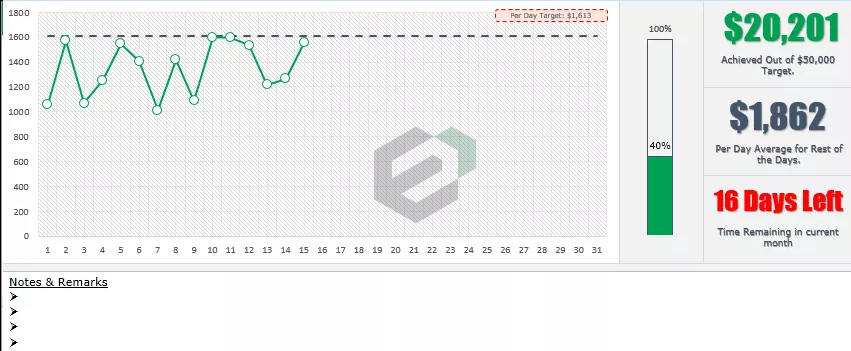
If you are looking for daily Sales report or Sales MIS reports format in Excel or Spreadsheet, this can be the webpage where your search ends. This is a one page sales reporting format.
Business managers, professionals and executives can use this sales reporting dashboard as sales tracker, daily sales MIS report, Sales Target vs. Actual report.
About daily sales report template in excel
After downloading this simple and easy to use sales report, you can quickly start creating line graph for your sales KPI. There are some features which might interest you in using this template and understanding whether this template meets your requirement or not.
- This report for Sales Reporting on daily basis has two components, which is presented in the line graph. When you enter the daily sales figures in the table below, graph highlights the comparison automatically. A small box in the top of the graph, highlights the average sales target required on each day to meet the periodic targets. The two components are –
-
- Monthly targets
- Daily sales performance
-

- There is a thermometer chart incorporated in the template or say, Sales reporting Dashboard. If you want to learn about thermometer charts, you can visit our tutorial on how to create thermometer chart in excel. The thermometer chart in the sales reporting dashboard will showcase how much percentage we have achieved on daily basis to meet the overall sales target. This is essential to track so that remediation can be done, if required.
- Now, in this sales reporting dashboard, we have a Till Date Sales against the target. This is a simple cumulative figure of all the actual sales that has happened during the said period.
- Just below the cumulative figure of all the actual sales, we have a per day average sales. Somedays, sales can be higher and some days business can go dry with minimum sales. Average figure of all the sales during the days in the period, can help you understand the daily performance.
- Sales and marketing is a tricky business process and mostly driven by targets and deadlines. Hence, we have also placed a “Time/ Days Remaining column” in the dashboard. This will help managers, professionals and executives track the days left to meet the target.
- Notes and remarks section in the template can help reviewers put up their reminder remarks, review remarks, learning notes etc.
Download and use Sales Reporting Dashboard in Excel
The input data essential to understand in this template –
- Select the current month to track your sales on daily basis. To do this, select the relevant month from the dropdown list. Selecting month is important to define the number of days.
- Once the month is select, next important input data will be to define and update the sales target. there is a direct connection between monthly targets and number of days. per day average target sales will be computed automatically.
- Now, you need to track the sales in Sales Reporting Dashboard. You will find the table like below where you can capture the sales figure on daily basis.

Let us discuss on the how to download and use the daily sales reporting dashboard in excel. To download and use this free sales reporting excel template, follow the steps below –
- Firstly, You should have Microsoft Office/ Microsoft Excel installed in your system.
- After installing Excel or Spreadsheet, download the zip file of this template, extract the template using WinRAR or 7Zip decompressing software.
- Once extracted, you can open the file using Excel and start entering data or customizing the template.
- Furthermore, To download fonts and typefaces compatible with Microsoft Excel > Calligraphic.net.

