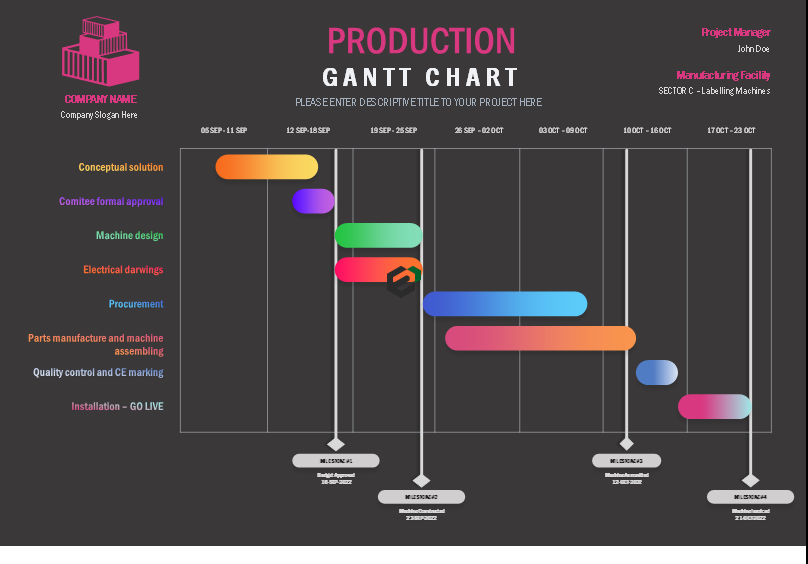
Download production Gantt chart for your production project. This excel template is useful for project managers who want to track and monitor the activities in their production unit. You can segregate the whole production unit into mini-units which will help you monitor and organize the activities in the production function. Excel Gantt Chart template can help you enhance the quality of your management review processes.
Understanding Gantt Charts
Gantt charts help teams to plan work around deadlines and properly allocate resources. Projects planners also use Gantt charts to maintain a bird’s eye view of projects. They depict, among other things, the relationship between the start and end dates of tasks, milestones, and dependent tasks. Similarly, this production Gantt Chart can help you track and monitor the activities going on in your Production Function.
Benefits of using Gantt Charts
Gantt charts in multiple projects and production activities can be helpful and beneficial in various grounds. Gantt charts help you organize projects, improve overall project visibility, and keep everyone on track. Gantt charts also help managers provide resources when and where they need them. And they encourage collaboration among project team members.
Download and use production Gantt Charts
To download and use this free production Gantt Chart excel template, follow the instructions below –
- Firstly, You should have Microsoft Office/ Microsoft Excel installed in your system.
- After installing Excel or Spreadsheet, download the zip file of this template, extract the template using WinRAR or 7Zip decompressing software.
- Once extracted, you can open the file using Excel and start entering data or customizing the Gantt Chart template.

