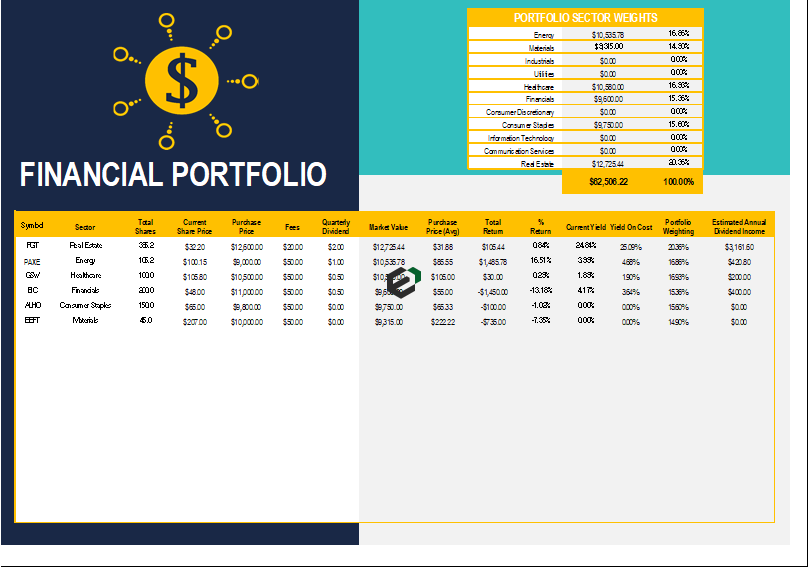
Download financial portfolio dashboard free excel template. This investment tracking spreadsheet is useful for professionals and retail investors to track their financial investments and its performance. This investment portfolio dashboard excel template can be easily modified as per requirements.
Understanding Portfolio Dashboards in Excel
Portfolio Dashboard means a excel template or dashboard program for the administration and audit of a pool of investments an organization dedicates to various business projects. It tracks and measures the status of investment activity through a range of key performance indicators (KPI).
Ways to monitor health of your investment portfolio
Monitoring how your portfolio has been performing overall, not just in the last month, is the best antidote to help you remain calm and make the best decisions.
What is portfolio monitoring and how you use it to your advantage?
With this section of the blog, learn more with these four basic ways to monitor the health of your investment portfolio –
- Track the annualized total performance of your portfolio. You must track everything like brokerage, dividend and account maintenance fees.
- Monitoring performance and returns through dividends. If you are not tracking the dividends and yields, you are not capturing the whole picture. You should also take into picture the tax implications on the dividends and reinvested amount of dividends.
- You must try to allocate and categorize the investments into various industries like
-
- Telecommunications,
- Finance,
- Technology services,
- FMCG,
- Banking services etc.
-
- Sector wise segregation is to be mapped with the sector performance and your portfolio performance. Correlation between the industry growth and portfolio growth helps you identify the bottlenecks in your financial portfolio. This comes under benchmarking.
About Financial Portfolio Dashboard Excel Template
Once you download this investment portfolio dashboard excel format, you will see that it is elegant and easy to use. You will have to update the information of your financial portfolio by entering the information like
- Symbol of the share
- Sector of the investment
- Total shares purchased or in the portfolio
- Purchase Price of shares (average cost)
- Fees towards brokerage, commission, taxes
- Expected and declared quarterly dividends, if any
- Market value (Current market price)
Once you update the information highlighted above, following things will happen automatically –
- Dashboards computes the Market value of your investment in each share and sector wise.
- Estimated annual dividend income from the portfolio.
- Yield on cost, percentage of return on investment, Current quarter yield etc. gets computed automatically.
Download and Use Financial Investment Dashboard format in excel
To use this free Financial Investment Dashboard format in excel, you should have Microsoft Office/ Microsoft Excel. You can only use this template if you have these applications in your system. or Use, Google Sheets.
After installing Excel or Spreadsheet, download the zip file of this template, extract the template using WinRAR or 7Zip decompressing software. Once extracted, you can open the file using Excel and start entering data or customizing the template.

