Excel dashboards are useful in many occasions. Today, we will understand its usability in sales and marketing dashboards and the use of OFFSET Formula. The OFFSET formula is really unique. We can use it in such situations where we only want to display parts of a large data table.
From the list containing all states of the US we will only portray five states for this walkthrough documentation of this free excel dashboard. With the help of a slider (we’ll talk about it later in details) we’ll create a scrolling-list. Why is this good? How to build impressive dashboard templates?
It is irrelevant if we work with ten, a hundred or a million values. There is only one thing we have to pay extreme attention to, that the dashboard can only be strictly displayed on one page only. So we have to try to place the separate elements to fit them on one worksheet. In this short article there are many new information awaits you! Let’s start!
How to create a scrolling list to improve visual quality?

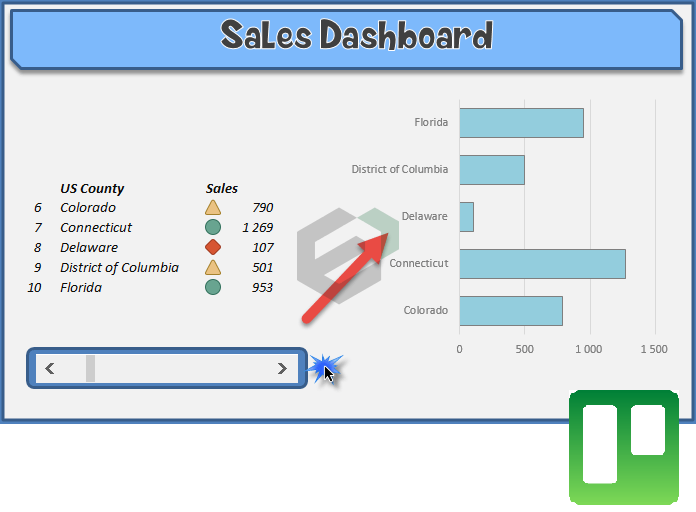
With the help of the next dashboard tutorial we will learn how to make a great looking dashboard using the OFFSET formula. Today’s lesson will be about creating interactive dashboards. Let’s see an example how useful can be the mentioned formula in some instances. We have put the base data in three columns: in the first one the number of the states, in the second one the name of the states and in the third one the income data belonging to these states. We will apply the formula to find raw data on the Data worksheet.
Use the OFFSET formula
The OFFSET formula gives us the first and last value of the list. The states not reaching the expected achievement will be marked by a red diamond. A yellow triangle will appear by those states that are near the expected achievement (+/- 5%, you can adjust this freely). The green circle means that everything is in great order, namely the achievement is over the indicators designed by us. We like the latter the best.
Wish everything would go like this always!
Scrolling list tutorial – The Slider
Under the achievement summary table there is a slider. By moving the slider to the right and to the left simultaneously the contents of the list continually changes and contains only the actually chosen 5 purports. This is how we make our presentation quick, dynamic and spectacular.

The slider has a wide-ranging use, its primary task to control the listed data. It is clear that this is a space-saving solution, we don’t have to list all data of all the states, thus the dashboard can be used simply and clearly arranged, it is essential for senior managers. It is worth to consider the latter one seriously; senior managers do not usually have time to look at a chart for days. Our task is to show the results in a brief and possibly spectacular manner. On the right side of the picture there is the dynamically changing graph, there is no devilry in this, we only tied the chart to the data of the acutely shown states.

Conclusion: Create dynamic presentation!
If you liked the demonstration than do not hesitate fascinate your boss with a similar presentation! Trust the success will not keep you waiting we are sure of that. If you want to use PowerPoint Presentation or include this dashboard screenshot in the PowerPoint Presentation or Google Slides, You can find hundreds of Free Presentation Templates, Designs and Dashboards at SlidesGeek.