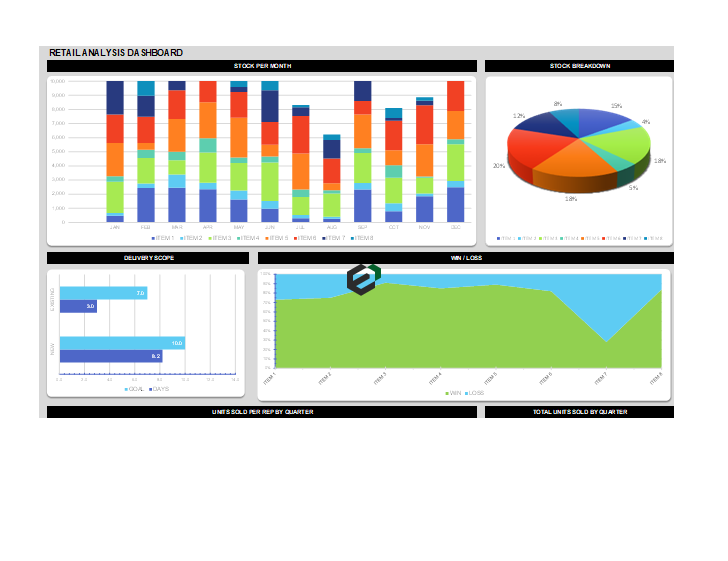
Download retail and sales analysis dashboard excel template. This free dashboard excel template uses combination of stacked bar chart, pie chart, area graph and charts.
About Retail and Sales Analysis Dashboard
To understand what this dashboard relevant for retail and sales area has to offer, we need to understand the key performance indicators first. Sales and Retail KPIs are important aspect to understand and grow business. To identify the improvement opportunities in your sales and retail chain, you should lay down the KPIs that are important and monitor them.
Thus, this excel dashboard helps sales managers, business managers, owners, retail investors, retail chain owners to laydown sales KPIs and monitor them in an infographic and visualized manner.
The Sales KPIs addressed by this dashboard are –
- Item wise monthly inventory
- Annual average Stock and
- Percentage of each product in annual average stock
- Item wise win and loss
- Sales Representative wise sales
- Sales Representative wise product sales
- Quarterly Sales [Units Sold]
- Delivery Scope, Goal and Achievement
There are tables in the attached template file where you can update the relevant information. Charts and dashboards update automatically.
Important things for sales dashboard
In order to create a sales and retail dashboard like the one provided here, you have to understand and be careful about few factors. This is a step by step highlights for everyone who wants to create a sales dashboard in Excel, Spreadsheet or PowerPoint for their business or client.
- Lay the Level Zero Work – Level zero work involves identifying the relevant KPIs. Like we mentioned in the above section, understanding the KPIs to monitor is important.
- Finalize the playground. Understand the requirement and finalize where you want to create your dashboard – it can be excel, spreadsheets software or PowerPoint.
- Import your data into the dashboard/ source file.
- Advanced functions and designs. Post importing the data, now you have to design your dashboard. While using charts and graphs, always be careful. Learn the basics of charts and graphs so that you can deliver the information and quality information through visualization.
- Learn and improvise your dashboard as you move ahead with reviews and feedbacks.
Download and use Sales and Retail Dashboard Excel Template
To download and use this free sales and retail dashboard excel template, follow the instructions below –
- Firstly, You should have Microsoft Office/ Microsoft Excel installed in your system.
- After installing Excel or Spreadsheet, download the zip file of this template, extract the template using WinRAR or 7Zip decompressing software.
- Once extracted, you can open the file using Excel and start entering data or customizing the template.

