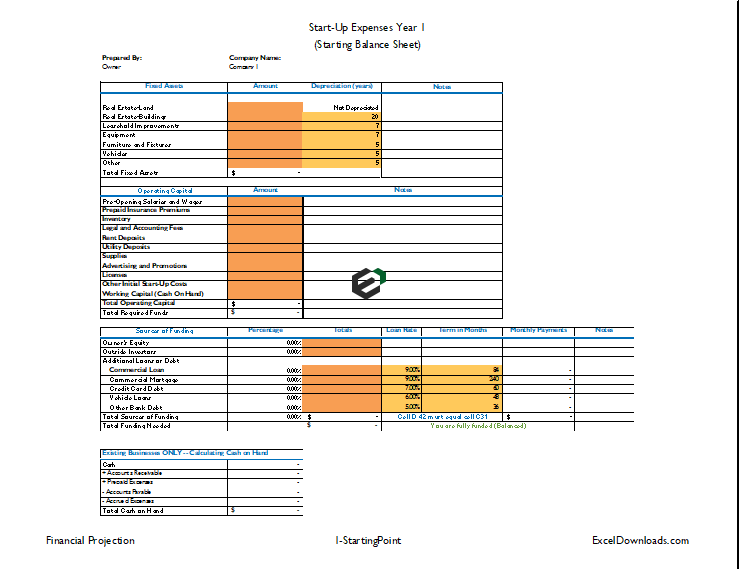
Download this easy to use and free financial projection template in Microsoft Excel and Spreadsheet. This is useful for startups with Year 1 projections requirement. You can also customize and use this for your existing businesses. This financial model or projection template takes into account various accounting standards and assumptions.
Understanding financial projections in business
Financial projections use existing or estimated financial data to forecast your business’s future income and expenses. They often include different scenarios so you can see how changes to one aspect of your finances (such as higher sales or lower operating expenses) might affect your profitability. (Source : SCORE)
Why financial projection template ?
A financial projections template uses estimated or existing financial information to forecast the future expenses and income of your business. These projections don’t just consider a single scenario but different ones so you can determine how the changes in one part of your finances might affect the profitability of your company.
A financial projections template is a tool that is an essential part of managing businesses as it serves as a guide for the various team to achieve the desired goals. The preparation of these projections seems like a difficult task, especially for small businesses. Financial projection and Financial Statements are similar jargons but have different purpose and methodology.
Inclusions of Financial Projections
A financial projections template usually includes a few financial statements that will help you achieve better financial performance for your business. Let us break down the components and understand each of these in detail –
a. Income Statement
Also called the Profit and Loss Statement, this focuses on your company’s expenses and revenues generated for a specific period of time. A typical income statement includes expenses, revenue, losses, and gains. The sum of all these is the net income, a measure of your company’s profitability.
b. Cash Flow Statement
Taking a look at a cash flow statement makes you understand how your company’s operations work. The statement explains in detail how much money goes in and out of your business in the form of either expense or income. This document includes the following:
-
Operating Activities
The cash flow from operating activities reports cash outflows and inflows from your company’s daily operations. This includes changes in accounts receivable, cash, inventory, accounts payable, and depreciation.
-
Investing Activities
You use the cash flows from investing activities for your company’s investments into the long-term future. This includes cash outflows for purchases of fixed assets like equipment and property and cash inflows for sales of assets.
-
Financing Activities
The financial activities in a cash flow statement show your business’ sources of cash from either banks or investors along with expenditures of cash you have paid to your shareholders. Total these at the end of each period to determine either a loss or a profit.
The cash flow statement gets connected to the income statement through net income. To make this document, it requires the reconciliation of the two documents. You can calculate net profitability or income in the income statement which you then use to start the cash flow from the operations category in your cash flow statement.
c. Balance Sheet
Balance Sheet is a statement of your business’ liabilities, assets, and capital at a specific point in time. It details the balance of expenditure and income over the preceding period. This document provides you with a general overview of your business’ financial health. Here is an overview of these components:
-
Assets
These are your business’ resources with economic value that your business owns and which you believe will provide some benefit in the future. Examples of such future benefits include reducing expenses, enhancing sales, or generating cash flow. Assets typically include inventory, property, and cash.
-
Liabilities
In general, these refer to the obligations of your business to other entities. In more common terms, these are the debts that your business incurs in your daily operations. It typically includes loans and accounts payable. You can classify liabilities either as short-term or long-term.
-
Owner’s Equity
This is the amount you have left after you have paid off your liabilities. It is usually classified as retained earnings – the sum of your net income earned minus all the dividends you have paid since the start of your business.
Together with your break-even analysis and financial statements, you can include any other document that will help explain the assumptions behind your cash flow and financial forecast template.
This template tries to include all these components. You can use this template to project the financial performance, sales expectations, operating expenditures possible for upcoming years for your business or your client’s business.
Download and use startup financial projection excel Free template
To use this Startup financial projection template, you should have Microsoft Office/ Microsoft Excel installed in your system.
After installing Excel or Spreadsheet, download the zip file of this template, extract the template using WinRAR or 7Zip decompressing software. Once extracted, you can open the file using Excel and start entering data or customizing the template.

