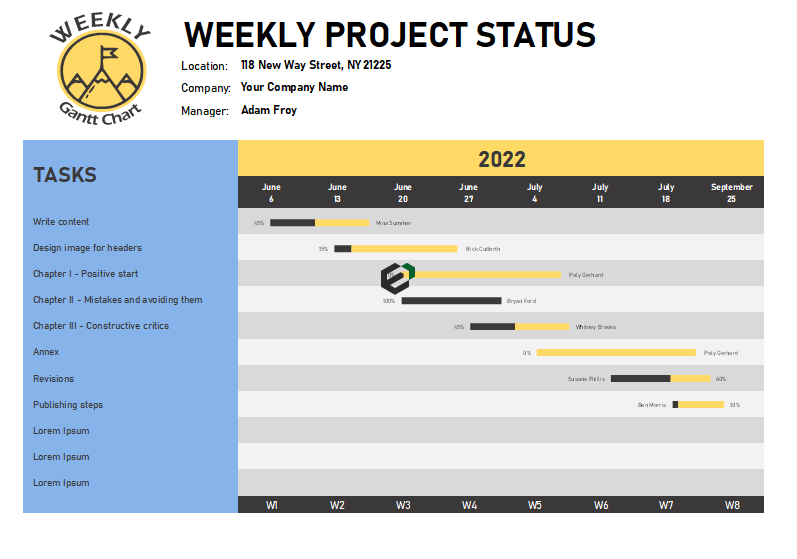
Gantt chart is one of the useful chart for project management. It is useful for planning and scheduling various activities and sub-activities in a project. Basically, this would involve assessing how long a project should take, determine the resources needed, and plan the order of completing the task.
Gantt charts for project status
Download this free weekly project Gantt Chart excel template to implement it in your project. Gantt Chart is based on the idea to organize resources, monitor project at minor tasks and sub-tasks level. Gantt Chart can be useful in software development, construction, research and studies and many more. The use of Gantt Chart can help you enhance the quality of your management and review processes.
A Gantt chart is a project management tool that illustrates a project plan. It typically includes two sections: the left side outlines a list of tasks, while the right side has a timeline with schedule bars that visualize work.
History of Gantt Charts
A Gantt chart is a type of visualized bar chart that illustrates a project timeline and progress. This chart lists the tasks to be performed on the vertical axis, and time intervals on the horizontal axis. Gantt charts were first created in 1896 and later revised by Henry Gantt in the early 1900s.
Making Project status better
Depending upon the nature and type of the project, the management review and periodic status update meeting can be of different nature. However, in a general note, we have listed down six important ingredients that should be there in your project status report to make it more relevant, informative and better –
- Activity level tracking widgets can help management and reviewer quickly understand the status at each activity level. However, do not keep all the details, make it more visualized and summarized.
- Use of Bars and Charts for status of each activity in the overall project can be more effective and informative.
- Milestones and plan versus actual widgets in your project status can give an insights on what was planned and what has been achieved. If there is under achievement, reviewer can provide positive feedback for quick round up. If there is over achievement, reviewer can understand the contributing factors to make the situation and environment last long for timely completion.
- Resources allocation in a project should be clear, crisp and definitive.
- Team workload status and bandwidth available / bench reports also bring light to the resource utilization ratio in a project.
- Personal to-do list in the project status report can help reviewer understand – what initiatives have been taken to make the timelines more realistic.
Download and use weekly project Gantt Chart
To download and use this free weekly project Gantt Chart excel template, follow the instructions below –
- Firstly, You should have Microsoft Office/ Microsoft Excel installed in your system.
- After installing Excel or Spreadsheet, download the zip file of this template, extract the template using WinRAR or 7Zip decompressing software.
- Once extracted, you can open the file using Excel and start entering data or customizing the Gantt Chart template.

