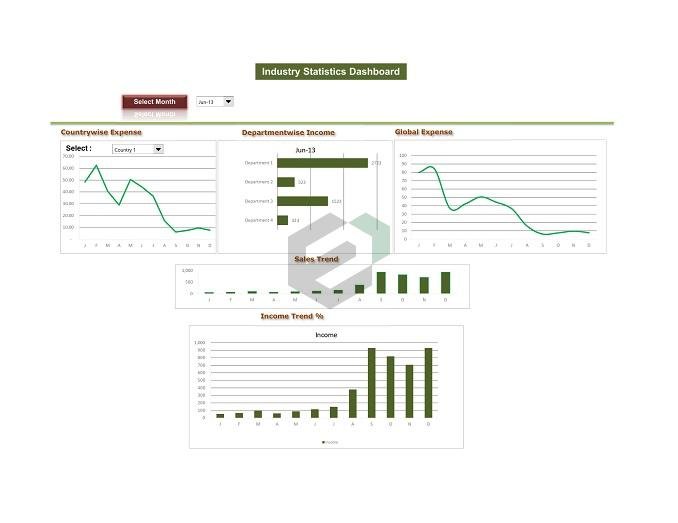
Industry Statistics Dashboard is a free excel dashboard useful for study of industry. Preliminary analysis for any new idea is essential. Thus, business managers and owners can use this template to conduct study of new industry, competitors and many more. Business students and teachers can also use this template for their assignments and teaching purposes. In day to day life when we talk of business, analysis is very important factor to run business successfully. Analysis helps us in getting a clear idea of profit or loss of a business and also how, when and where business strategy needs to be changed.
It would be very difficult to understand about the profit/loss if we have only data with us. There are chances that we might get a vague idea of our business. At this point dashboards give us clear idea of our business.
About Industry Statistics Dashboard Free Excel Dashboard
The template takes an example of an industry which is involved in selling products through website. This industry is running business in different countries since January 2013. Management wants to compare their stats sales wise, country wise, globally, how much they spend on advertisements and their income. You can customize the dataset in the main worksheet in the dashboard. Changing parameters can be done using the Parameters Worksheet.
The dashboard updates automatically when the data is uploaded in the table. furthermore, you can add more fields and columns as per your requirement. You can add more charts and graphs to make your Industry analysis and assessment more relevant and infographic.
How to download and use Industry Statistics Dashboard Excel template ?
To use this free Industry Statistics Dashboard template, you should have Microsoft Office/ Microsoft Excel installed in your system. After installing Excel or Spreadsheet, download the zip file of this template, extract the template using WinRAR or 7Zip decompressing software. Once extracted, you can open the file using Excel and start entering data or customizing the template.

