Download free tiered commission structure template in Excel and Spreadsheet. This template is useful for sales and marketing team, if they have tier based commission payout structure. Hence, it is useful for business managers, sales managers, business leaders, professionals, sales expert, sales specialist and consultants.
This template uses combination of SUMPRODUCT, VLOOKUP and other important formulae in Microsoft Excel.
About Tiered Commission Structure Table Excel Template
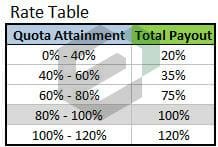
Let us first understand how a tiered commission structure looks like –

The first column contains the quota or tier ranges and second column highlights the payout ratio that will be executed, upon reaching or falling into the certain quota. Now for example, If the sales person (rep), say, Hari, sells 40% of his quota then he will receive 20% of their commission. If he sell 60% of quota, he will receive 35%, and so on down the table. Sounds easy, right ?
Now, the challenging part in this process is when the attainment amount falls in between the ranges (extreme points). Example, if the sales person sells 50% of his/her quota? The rep would receive 20% payout for the first 40% of quota, and an additional 7.5% payout for the last 10% of quota. The last 10% of quota attainment is calculated by finding the payout rate at each tier. So the total payout on 50% of quota would be 27.5%.
Most easy solution
In Microsoft Excel, you can create a full functioning tiered commission structure table by way of following solutions;
- To calculate the payout at every tier and then sum the payout amounts to get the total amount. Or
- Complicated IF statement to determine the payout all in one formula.
The attached excel template, uses SUMPRODUCT Formula (Solution 1).
Explained SUMPRODUCT Solution
The SUMPRODUCT formula for Total Payout is:
=SUMPRODUCT( (Attainment > [Tier Min]) * (Attainment – [Tier Min]) * [Differential Rate] )
Variables in brackets [] refer to entire column in rate table.

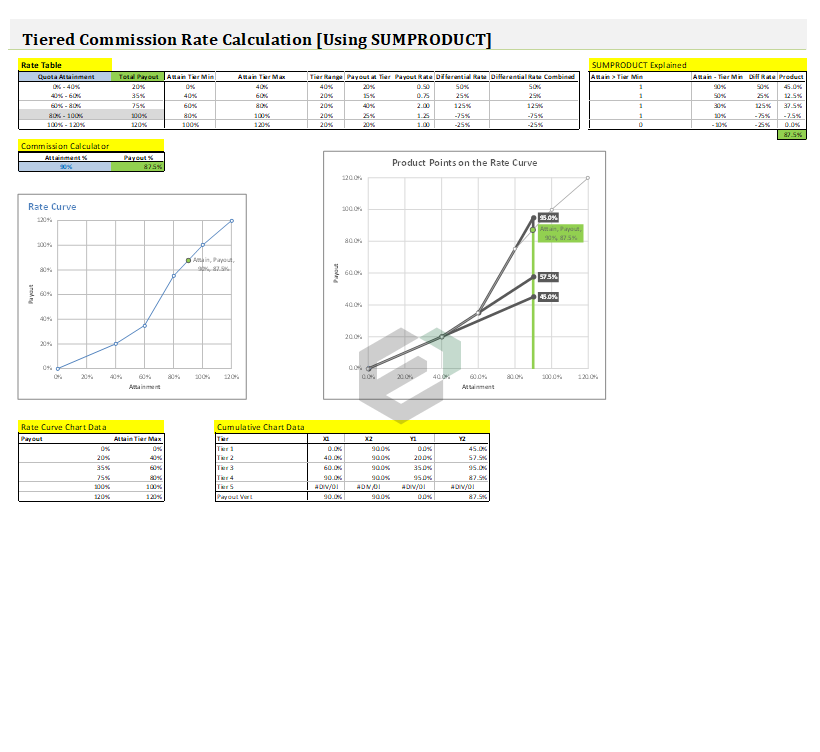
The following steps or workflow splits the SUMPRODUCT formula into multiple columns and rows for a clearer visual of how the formula is calculating the total payout.
- Attain > Tier Min: Returns a “1” if the attainment is greater than the attainment tier minimum. If attainment is 90%, then the condition is true for the first 4 rows and a value of 1 is returned.
- Attain – Tier Min: Finds the difference between the total attainment and attainment tier minimum. This is necessary because we are multiplying it by the differential rate. So in the first row we are taking the entire attainment of 90% and multiplying it by the diff rate of 50%. Each subsequent row is taking the leftover attainment for its tier range, and multiplying it by the payout rate that is leftover for its tier (the diff rate).
- Diff Rate: The differential rate for each tier.
- Product: Column 1 * Column 2 * Column 3
- Sumproduct: Sum of the Product column. The total payout on 90% attainment is 87.5%

You can find visualization of the Product column plotted in the Line Graph as well. This will help users and readers understand the computation and end result more clearly.
This commission at tier based template in Excel is very useful and easy to customize tool.
Download and use Tiered Sales Commission Rate Table excel template
To download and use this free commission in tiers calculator excel template, follow the steps below –
- You should have Microsoft Office/ Microsoft Excel installed in your system.
- After installing Excel or Spreadsheet, download the zip file of this template, extract the template using WinRAR or 7Zip decompressing software.
- Once extracted, you can open the file using Excel and start entering data or customizing the template.
- To download fonts and typefaces compatible with Microsoft Excel > Calligraphic.net

